Managing Supplier Quality with Remote Data Monitoring and Alerts

Managing Supplier Quality with Remote Data Monitoring and Alerts

teradyne_logo

Summary

This IntraStage Case Study describes the benefits that were realized by Teradyne’s application and use of the real-time IntraStage Supplier Quality System. Benefits of implementation of the IntraStage solution included faster time to manufacturing, better quality, and lower costs.

Background

When producing highly complex test equipment, Teradyne is no stranger to cost, time and urgency. As a world leader in the automatic test equipment (ATE) market, Teradyne is a leader in the application of thorough, comprehensive test processes and quality control. As part of its commitment to its customers to produce an ATE tester that is free of defects, reliable, and capable, Teradyne’s focus on quality is not only dependent on quality from the manufacturing floor, but also from supplier-sourced components.

Bryan Johnson, a supplier engineering manager at Teradyne, foresaw a problem with their current supplier management: “We proactively worked with suppliers to qualify parts and establish robust control plans.  But, in addition to normal process audits, we needed to assure the control plans at our suppliers were being executed based on real time data collection and analysis.  We were also concerned that processes for our most challenging parts could drift over time, impacting yields and the ability of suppliers to ship the quantity of parts we needed on time.  We needed Statistical Process Control (SPC) deployed for a global supply base that often-lacked knowledge and experience with SPC methodologies and needed a data archive for our most challenging and important component specifications.”

Requirements

Instead of depending on suppliers to both learn and develop skills in SPC, Bryan and his team started evaluating options for performing what he calls ‘remote data monitoring and alerts’: making sure that the suppliers are capturing critical parametric performance metrics automatically before their product ships out to Teradyne. ‘It was critical that we have a blended model of data input: both manual data entry, and to support existing file outputs by those suppliers with minimal disruption to their processes and productivity. We also wanted to make sure that suppliers could benefit from the system and gather the data that would help them to improve their processes, yield and quality.’

With multiple suppliers, including some suppliers making the same component, security and supplier access to the correct information were also critical.  Data from these processes can remain in silos, which creates obstacles for Teradyne engineers to access, analyze, and use to improve testing processes and product design. Therefore, the Teradyne engineers would have to maintain a complete view of all suppliers’ data and performance. The engineers’ goals were to:

– Minimize quality-based supply chain disruptions to ensure Just In Time (JIT) manufacturing
– Ensure early visibility of supplier quality issues
– Reduce customer recalls and quality issues
– Maintain yields of our most challenging parts

Implementation

Using a blend of IntraStage’s Paperless Manufacturing product and customer adapters allowed Teradyne to incorporate data from multiple sources. The Paperless Manufacturing forms were customizable via a GUI, which allowed Teradyne engineers to self-serve and develop new forms quickly, and to edit the forms to capture richer metadata from the suppliers. The custom adapters converted source data into the IntraStage cloud-based database, allowing real-time visibility of the test data by both Teradyne and the suppliers. By receiving and being alerted on this data in near real-time, Teradyne and their suppliers could take action on potentially negative emerging trends.

Analysis

A key output of the data capture was the implementation of Western Electric Rules and Statistical Process Control analytics on the source data. Bryan Johnson’s team was not satisfied if the data were merely passing; they wanted to see if data were starting to develop negative capability indexes based on Cpk and Cp. By keeping an eye on SPC tables giving every parametric measurements’ Cp and Cpk, a quick visual check could easily identify performance. Drilldown into each parametric measurement on Xbar-R and characterization charts could quickly identify useful variables responsible for performance degradation. By identifying emerging trends, corrective actions were taken prior to potentially bad components even being shipped to Teradyne.

Lessons learned

By keeping critical supplier data in an off the shelf IntraStage database, with near real-time alerts and notifications, Teradyne has been able to better work with suppliers to maintain tight quality and time to market. Teradyne is maintaining and growing market share by maintaining brand quality and customer satisfaction with it world-class testing equipment. IntraStage’s BlackBelt manufacturing system gave Teradyne the tools it needed to not only understand where its supplier parts needed additional testing and attention, but detect emerging trends in real time to avoid issues in the first place.


For more information, contact sales@intrastage.com


Learn How You Can Achieve Similar Benefits Using WECO and SPC

Sample IntraStage WECO report

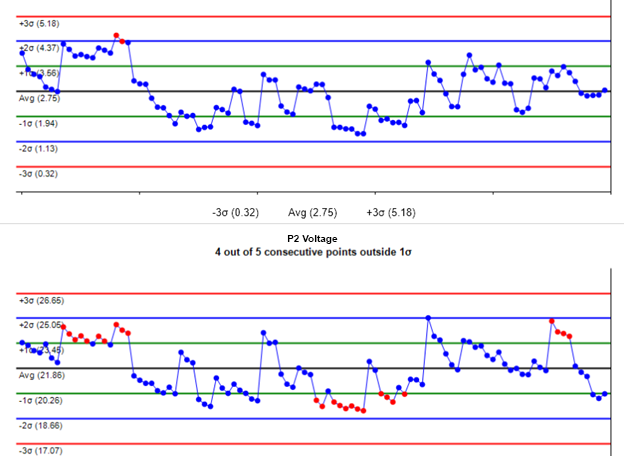
Sample Fictitious Data in an IntraStage WECO report

How Does IntraStage Facilitate Intelligent Data Analysis

Many organizations today struggle with getting meaningful insights out of their Test Data. Partly this is due to the complexity of the collection and aggregation of the data, and also partly due to the actual types of data that is recorded at the Test Stations. This complexity is largely a result of the multitude of different file formats that exist within Test teams and organizations. Even in a specific product family there can be multiple generations of test formats and the way to capture the Test Data can radically change. This results in a fractured ecosystem of data formats which make it difficult for Test Engineers and Management to get a global view of what is going on with their product quality.

With some careful planning, the test data collected from TestStand Database can be full of rich insights if some standard tags are added to the overall Test Data format. By standardizing on an output like Extensible Markup Language (XML), Automatic Test Markup Language (ATML) etc the re-invention of formats is eliminated. As the saying goes “Data is useless unless it is acted upon”. Test Data is key to identifying cost and throughput drivers on the product line. These new insights and capabilities can include Test Equipment Utilization, Test Equipment Accuracy, Yield Root Cause drill downs and Statistical Process Control (SPC).

With IntraStage you can seamlessly integrate test data from different sources and lower your product design, manufacturing and return costs by finding quality trends quickly and accurately.

IntraStage empowers businesses to make critical decisions easily and quickly throughout the product development life cycle with its Statistical Process Control Software. It has proved invaluable in uncovering improvement opportunities in both product design and manufacturing processes. Using a web based interface, IntraStage provides immediate access to all of your test data enabling you to quickly identify trends, failure analysis and yields. Built in QA routines such as CP, CPK, SPC and Six-Sigma help you identify the main issues affecting product quality.

IntraStage has no limit to the number of users who can take advantage of managing and analyzing their Labview database, from development engineers’ right through to manufacturing managers. By automating the process of collecting test data, OEMs can mine the data better and have the real-time SPC capability to view issues and respond quicker to potential problem spots. Due to real time and historical access to all your product test data you can visualize trends, SPC data which means to reduce product rework, retest, test cycles and bring faster response to complex hidden product problems.

Having deployed IntraStage you can achieve some meaningful results from the Test Data Tags implemented. Now it has become clear that with IntraStage’s Statistical Process Control Software we can do Intelligent Data Analysis and increase the quality of engineering decisions. Start using IntraStage today and improve your capabilities and reliability of the test data collection and statistical process analysis.

Statistical Process Control Techniques – An Overview

What is Statistical Process Control (SPC)?

Statistical process control (SPC) is a systematic decision making tool which uses statistical-based techniques to monitor and control a process to advance the quality or uniformity of the output of a process – usually a manufacturing process. It is commonly used in industry to measure the productivity or to measure, track and improve the ongoing performance of a process or determine if the process is in control or not.

The significance of SPC Software is that by monitoring the process and bringing the process under statistical control to identify and take action on special causes of variation. SPC is supportive to maximize the overall profit by improving product quality, improving productivity, streamlining process, improving customer service, etc.

What are steps involved in using Statistical Process Control (SPC)?

  • Plan: First identify the root cause of the problem and take corrective action to that problem. A corrective action is an immediate action as soon as the problem is identified.
  • Experiment / Research: When problem occurs SPC software helps to analyze and empowers you to make better engineering decisions easily and quickly throughout the product development life cycle.
  • Analyze: With the help of digitalized test data have a complete view of the manufacturing metrics and try to spell out all of the possible issues and send the data to R&D thereby improving product quality and customer satisfaction.
  • Act: If the result is successful then work on additional improvements. If the result is not yet successful then the look for other ways to change the process.

Specifically About Control Charts

Process control charts are just about simple-looking connected-point charts. The points are plotted on an x/y axis, with the x-axis usually representing time. The plotted points are usually averages of subgroups and they can also be individual measurements. SPC control charts exactly show the merits and demerits points of each process in a graphic format. Control charts help to identify the difference in a measurement during the time period that the process is observed.

More importantly, the chart will show you how the process is performing and how the process capabilities are affected by changes to the process. Also, they help to identify bottlenecks, waiting times, and other sources of delays within the process. Finally, SPC has advantages over other methods of quality control such as “inspection” because it helps to maintain the consistency of a process, which will result in a consistency in the quality as well.

Control charting helps distinguish between common cause variations that are always present and special cause variations that are out of statistical control. Statistical Process Control technique steps include detection, study, prioritization, illumination and then charting. Before using quality control software, it’s critical to collect proper data for analysis. You should first consider that quality is a sequence of continuous improvement. These control charting procedures are greatly assisted by SPC software like IntraStage.

Ready to give IntraStage a spin? IntraStage offers industry’s leading real-time SPC software for better and faster engineering decisions. It automates data collection and analysis on the manufacturing plant floor, allowing you to prevent defects before they occur. Start saving time, money and systematically improve quality and efficiency.