TQM, SPC and Six Sigma
If you have been in management or involved with large companies for any length of time, you have probably heard the terms TQM, SPC and Six Sigma. From a high level, these terms are virtually identical, so one typical question is what are the differences between them and why should you care… In this blog, we will try to answer both questions in a concise way.
TQM = Total Quality Management. This is a high level philosophy that focus on how to continuously improve the quality of your company’s products and services. TQM addresses quality from a very broad level, focuses on people (employees, customers, suppliers, motivations, teams, etc) and the impact that people have on quality. One big concept of TQM is that everyone has a customer, whether that customer is internal or external, and that every person has a responsibility to deliver quality to that customer is a way that is continuously improving.
While TQM was a huge buzz word in the 90’s, one of the negatives of TQM is that two similar companies could implement TQM and might do so in dramatically different ways and get very different results. For many people, TQM didn’t offer enough specifics on the tactical aspects and it wasn’t quantitative enough.
Enter SPC (Statistical Process Control) which has been around since the 1920’s, but wasn’t always embraced by manufacturers. Many feel that SPC concepts were effectively used by Japanese companies, whose growth in the 80’s scared American and European companies into action in the 90’s.
SPC uses basic mathematics (mean, median, standard deviation) of a set of measurements and offers a work-flow process for operators to read a chart and identify visually if their process is “in control” or “out of control”. The amazing aspect of SPC for many people is that a process can be nominally “passing” a test, meaning that it’s measurements fall within its high and low limits, but that the process may be “out of control” and ask risk to fail in the short term. In these cases, SPC serves as an early warning sign.
The positives of SPC are that it is (1) very quantifiable, (2) can help manufacturers catch issues early, (3) relatively easy to implement in software and (4) easy to train an operator to use.
The negatives of SPC are that (1) it can be very difficult to determine the key process indicators ‘KPIs’ that you want to track, (2) its usefulness is limited to processes that fit inside a “normal curve”, or Gaussian distribution.
Enter Six Sigma, on the heels of TQM, and with a goal to add more quantifiable results and processes. Six Sigma uses many of the concepts of SPC – in fact, the name itself “sigma” is the same as “standard deviation” in statistics and six is the number of standard deviations necessary to get a process to have only 3.4 defects per million. Whereas TQM had more “fuzzy” goals and tactics, Six Sigma is incredibly specific.
A commonly used example is to compare 99% quality (or one defect per 100 tries) with Six Sigma, which is 99.999966% quality (or 3.4 defects per 1,000,000 tries). A car company that is at 3.8 Sigma (99%) would have 3 warranty claims for every car produced, whereas a 6 Sigma level (99.99966%) would have 1 warranty claim for every 980 car produced.
In Summary, the three terms are all meaningful, all relevant for today’s companies, and all interrelated in how they help companies achieve better quality.
Paperless Forms 2.0 – Digitizing your Test Data
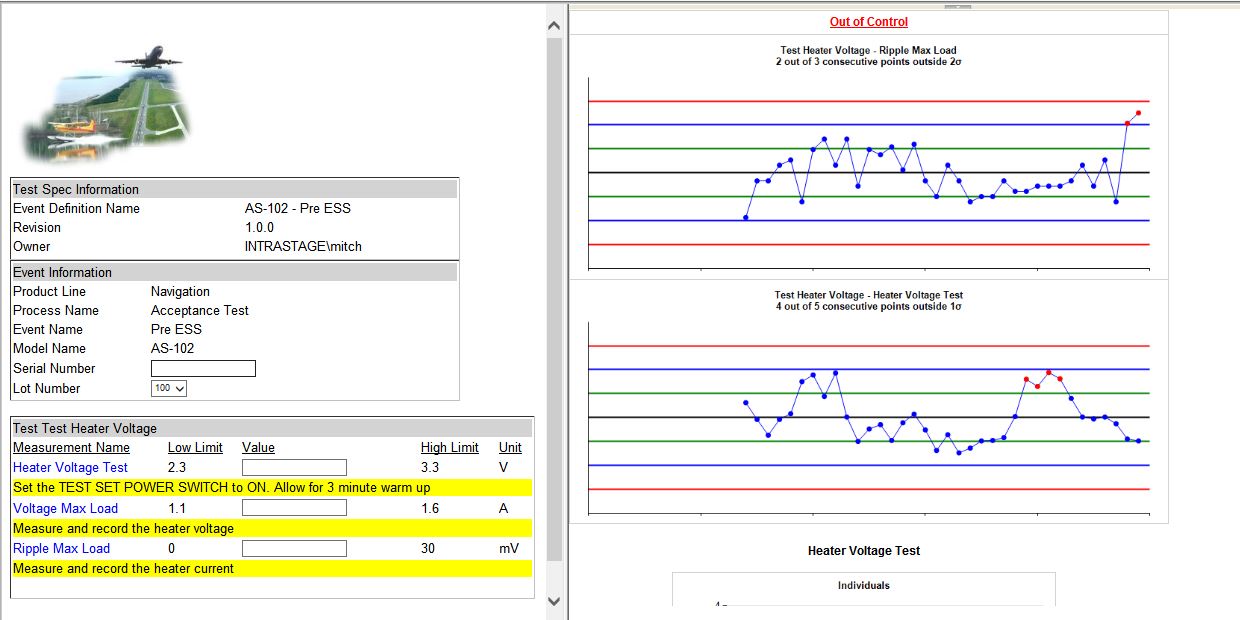
- Real-Time SPC on Test Data
- Web Based Forms for Test Data Collection
- Advance Reporting Capabilities
- Dashboard views of SPC Trends from anywhere in the World
Recall and Return events on Medical Device and Aerospace products can have serious outcomes where the FDA, your customers or other authorities quickly want to understand and root cause failures. These events have caused the industry to create rules around Compliance and Traceability on the Test Data.
In many manufacturing environments today, much of the Test Data is still recorded in Paper based processes. Paper based Test Data potentially means inaccurate recording, manual processes to retrieve that data and difficulty in aggregating the data to get an overall view of Quality. IntraStage Paperless forms solution was created to solve the massive amounts of Paper based Test Data that is currently being taken in Manufacturing environments around the world and give additional advantages:
- Quality engineers and inspectors are able to measure, manage, and report on quality activities as they happen, in real-time without straining resources.
- Seamless communication between Design and the Manufacturing teams. This means that you can quickly investigate and resolve issues faster
- Eliminate inaccurate spreadsheets, manual processes, and error-prone paper trails that come with hard-copy documentation.
Capturing Key Performance Indicators at a Glance
Key Performance Indicators (KPIs) are now an everyday requirement of large organizations. The problem today is that organizations are swimming in product quality test data and to understand their KPIs is a daunting task. Only now, are we seeing companies leverage their massive amounts of available Test Data through visualization software, mining tools and dashboards.
Dashboards allow the users to view the information they need to make an effective decision and to take appropriate action. Through active dashboards, businesses can implement an action plan and assign ownership for each KPI, should that KPI fall out its target range.
IntraStage offers personalized dashboards according to the roles and preferences of each user. By creating a tailored dashboard view that is relevant to the responsibilities of each person, better decisions can be made.
Compliance & Traceability: Problems happen…be prepared for them
Your Data, Your Demo
- Web Based Analytics to quickly root cause issues
- Full Traceability of all Test Data on Products
- FDA, Aerospace and other Test Data Compliance
Recall and Return events on Medical Device, Aerospace, and other Electronic products can have serious outcomes where the FDA, your customers, or other authorities quickly want to understand and root cause failures of those products. Whether the investigation is done via “paper” or through manual manipulation of spreadsheets with Test Data, the process can be prone to error, tedious and slow. In today’s fast pace environment and customer’s expectations of quick fixes to serious problems…this is no longer a competitive way to respond.
The IntraStage Analytics and Business Intelligence software can help:
- Providing compliance through having secure and permanent storage of all the Test Data
- Being able to quickly perform analytics on the Test Data through web based applications
- Providing full traceability on how the product was manufactured