


Overall Equipment Effectiveness (OEE) and Cycle Time are critical metrics describing how a product is performing in its manufacturing process.
The efficiency and speed of that process and its constituent machinery. Executive leadership needs these metrics to maintain profitability, efficiency, and manufacturing velocity.
With BlackBelt Enterprise, users can have real-time insight into analytics that not only drive these metrics, but also have root-cause workflows to identify, investigate, and resolve any OEE, Cycle Time, and utilization issues.
- Optimizing throughput and equipment utilization
- Trending event duration
- First Pass, Last Pass, and Rolled Throughput Yield
- Planned and Ideal Production Time
- Serialized unit traceability and history
- Normalized Data from Test, Process, and Assembly events
- BOM/Assembly/genealogy
- Data model that supports parametric and process analysis
- Serialized part history and traceability
- Event by iteration for FPY
- Standard data formats and connectors/adapters
- Accelerated time-to-market
- OEE
- Cycle Time
- Rolled Throughput Yield (RTY)
- First Pass Yield (FPY)
- Better operational efficiency
- Retest metrics
- Boneyard metrics
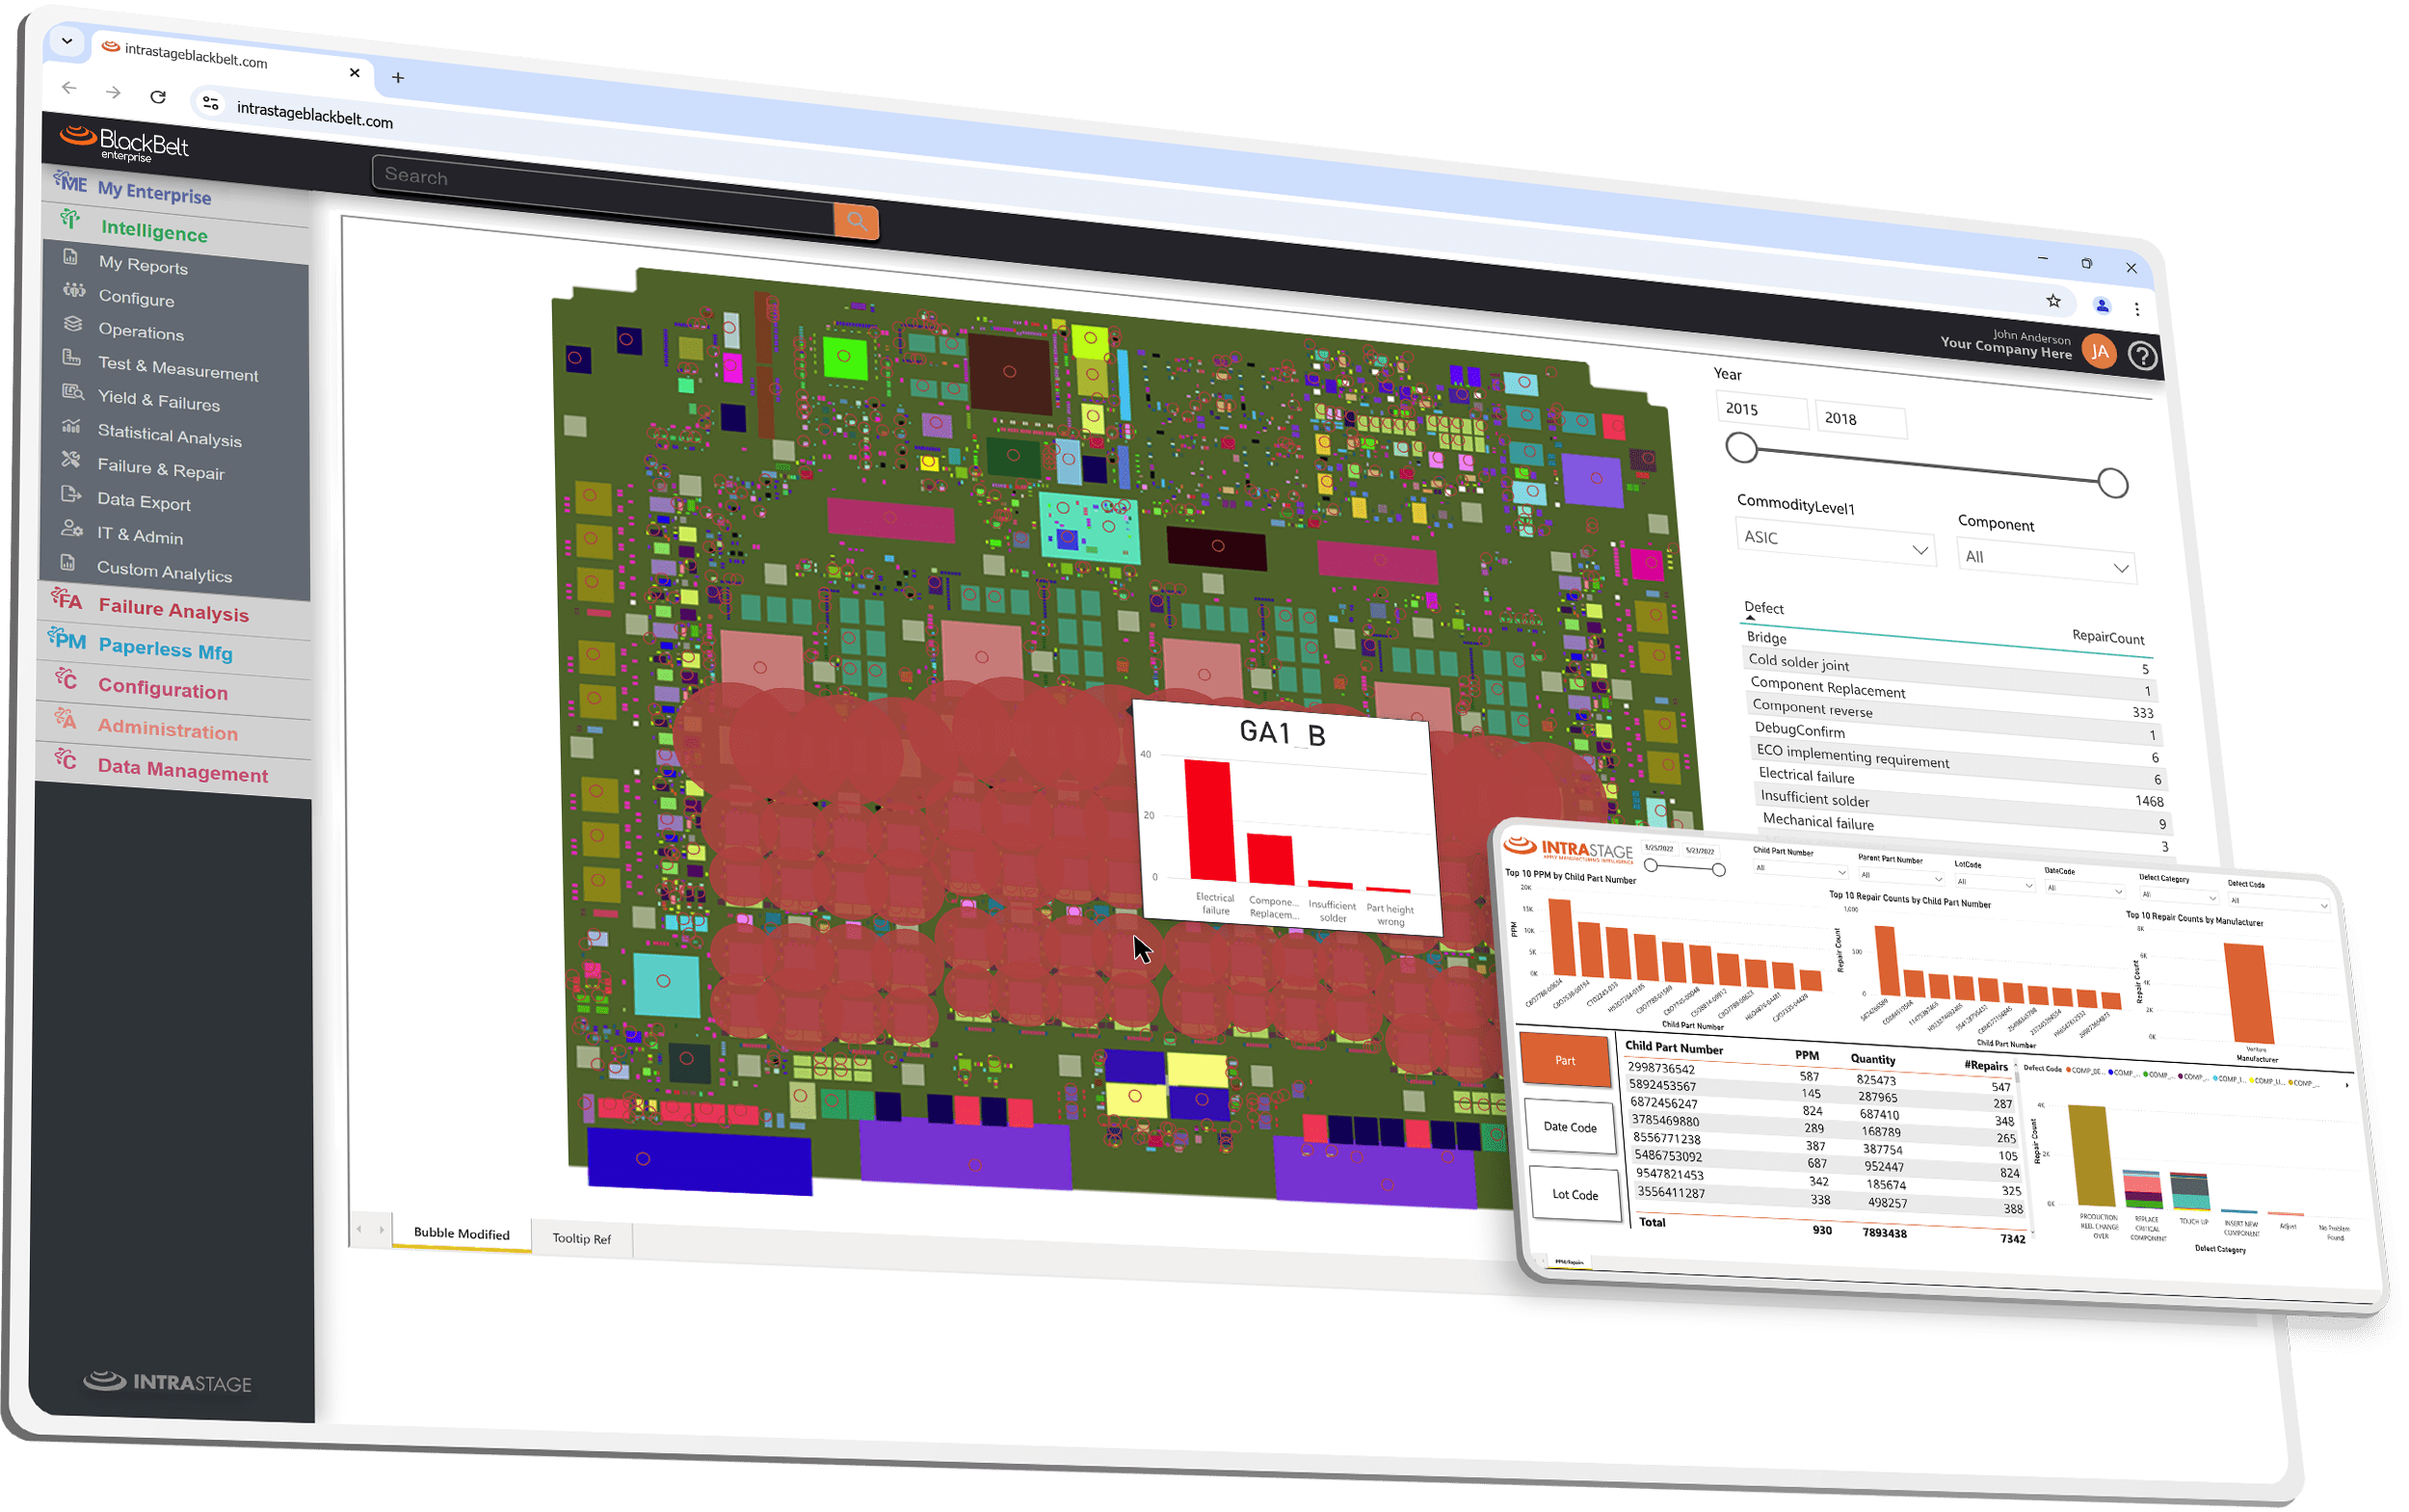
OEE and Cycle Time workflow with drill-down to underlying causes
In this OEE and Cycle Time workflow seen above, a user can quickly see real-time and historical information on OEE and Cycle Time. By utilizing BlackBelt Enterprise’s data model and Microsoft Azure and SSAS, the user can click on different parts of the analytic to explore why cycle time and OEE are performing the way they are (i.e., is ICT taking more time than expected? If so, I can click on ICT to see what the last calibration date for the testers, the trending failure rate, the trending SPC for all measurements for that model tested on those ICT testers, compare the ‘bone-yard’ of units waiting to be tested at each ICT tester, the yield rate of different ICT testers to see which is less capable than others, etc).
With this kind of business intelligence integrated in a workflow from the business outcome and metrics, an organization leverage the digital twin to not only know how they are performing in key business metrics like OEE and Cycle Time, but can also be cued to the correct actions to improve their performance.
Bold corporate-level initiatives like driving towards zero PPM or DPMO require aggregation of data from various sources. This often results in an implementation of a common Digital Twin data model that scales across product lines, manufacturing locations, and supply chains.
Supplier quality isn’t measured solely from supplier scorecards, incoming inspection, or inspection at the source. The quality of supplier parts needs to be gauged in manufacturing to see what is failing via PPM and DPMO. These metrics drive product quality and operational efficiency.
Having high-level metrics is good; having high level metrics integrated with workflows that leverage the underlying details that drive and provide insight into the metrics is better.
A board overlay is a prime example of having multiple sources of data inform a workflow that outputs in better quality and processes.
For complex electronics manufacturing, there are several common terms for the configuration of a unit: as designed, as built, as maintained
Another term we use at IntraStage is ‘as-is’.