


SPC tools and analytics need to provide the information you need to prevent problems and to resolve the issues.
The problem with Traditional Statistical Process Control/SPC (discussed at length here and here) is that it doesn’t allow them to easily root cause the issue that started the SPC problem.
Let’s start with an analogy:
A loved one wakes you up in the middle of the night and tells you they think they smell smoke, and that there could be a fire in your home.
You, obviously, feel obligated to calmly ask a few questions, like “Where is the fire? How big is the fire? Is it an electrical fire? Is anyone in danger? What started the fire?”
You loved one shrugs and repeats “Well, I think I smell smoke. It could be a fire. It could be nothing to worry about. We should probably check it out, but I don’t know where to start.”
That’s traditional SPC. While better than nothing, it doesn’t give you the workflows to instantly understand an issue, be able to investigate the issue further, resolve the issue, and feed that resolution back into the system.
SPC is being able to instantly be alerted to an issue, characterize on that issue, and learn from the issue.
Let’s go back to our original house fire analogy above, and put it in the context of next-generation SPC:
A loved one wakes you in the middle of the night, and says “A sensor we installed in our kitchen is telling us that one of our GCI outlets is heating up. The outlet on the counter that we usually use for the coffee maker is up to 32 degrees C; it was installed during the kitchen remodel two months ago. It’s not dangerous yet, but I’m concerned it will cause an issue. I have the Class-C fire extinguisher standing by should there be an electrical fire. Should we turn off the breaker to the living room as a precaution?”
Now you have a) information to understand the issue, its location, and characteristics, b) forewarning before the issue becomes a disaster, and c) how to remedy the issue.
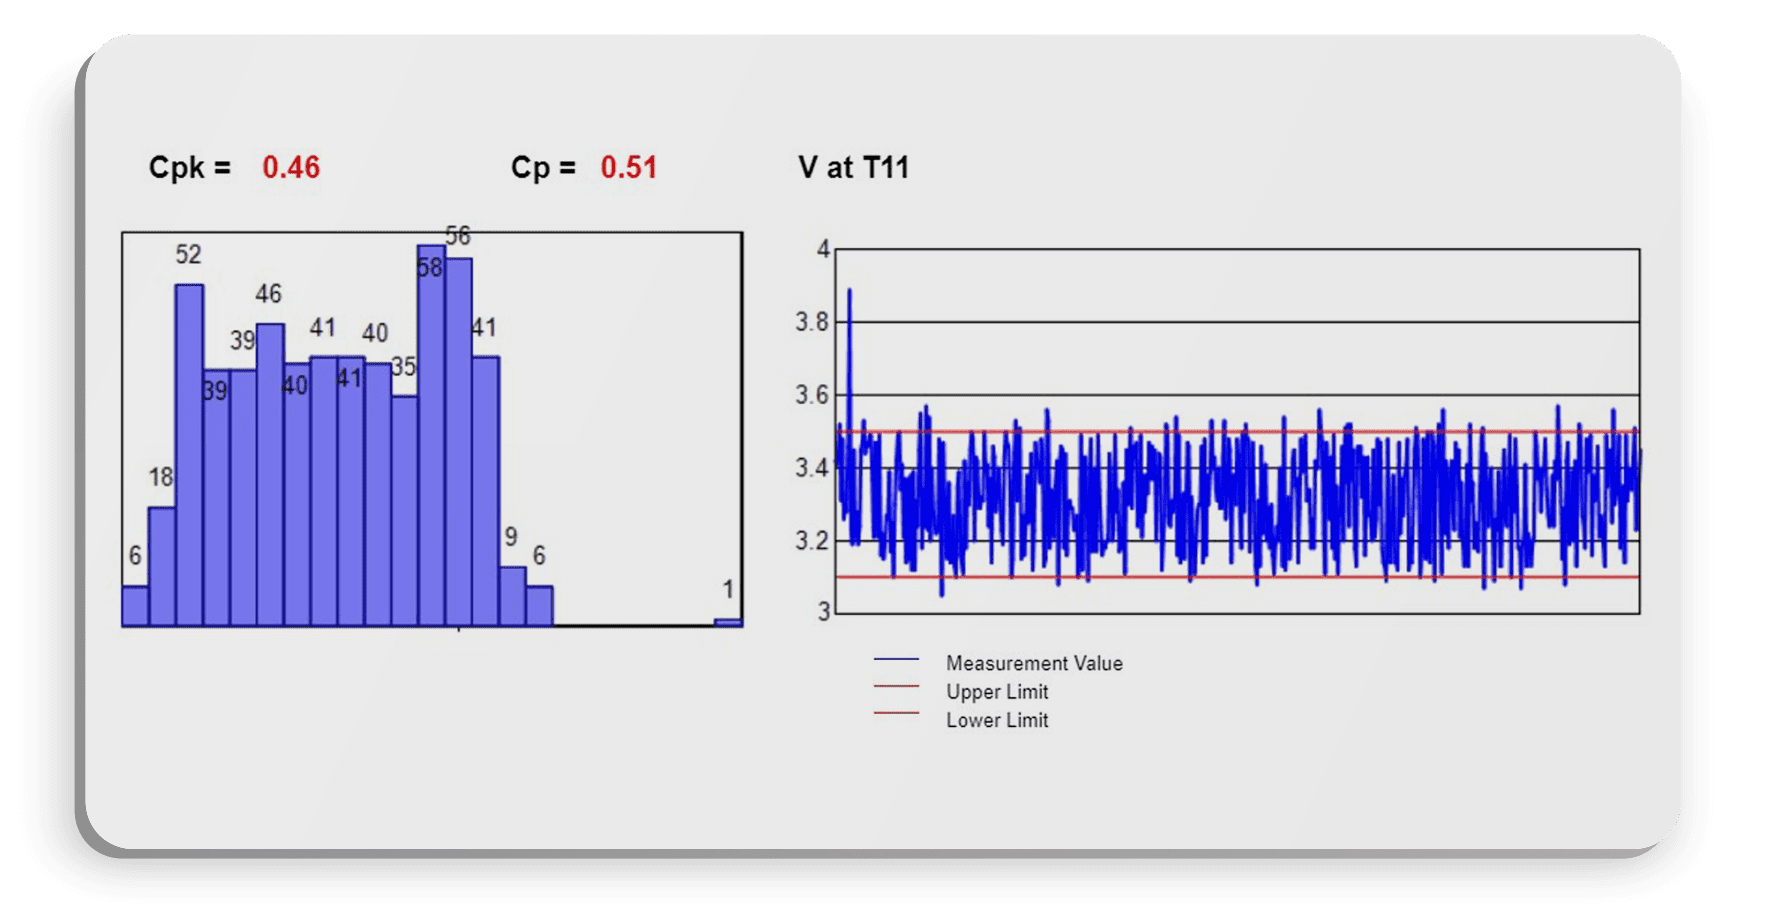
SPC tools and analytics should be no different; they need to provide the information you need to prevent a problem, and to resolve the issue. So let’s dig into how SPC tools should first give you forewarning about a measurement trending out of control.

An SPC system should alert key users before a process or measurement trends out of control. At the first hint of variability or risk to process integrity or efficiency, the system should send out contextual alerts with data and information on what happened, what could happen, the data informing the nascent issue, and the tools, analytics, and information needed to resolve the issue.
IntraStage provides software solutions designed to fit your needs. BlackBelt Analyze, BlackBelt Suite and BlackBelt Enterprise are built to streamline easy access to multiple data sources and generate actionable reporting in real-time.
Tiered feature sets based on your needs:
Once alerted, the user will need to characterize the measurement to understand the root-cause of the issue. Characterizing data means being able to have the factors and influencers of issues available immediately. For instance, let’s use the case of an FCT measurement going out of whack.
What could be the characteristics that drive the measurement’s variability? Let’s first look at a few of the characteristics captured in the source data. Using the Distribution Vary By stock report in BlackBelt Analytics, we can flip through all the characteristics and quickly find possible correlating and influencing factors. Since we have already run an SPC report on a specific measurement, there’s no need to change parameters or filters. Simply click on Distrbution Vary By, and run the report.
This report tabs out each characteristic, so it’ll be easy to visually see any influencer by seeing variations from the norm.
Let’s look at Work Order first:
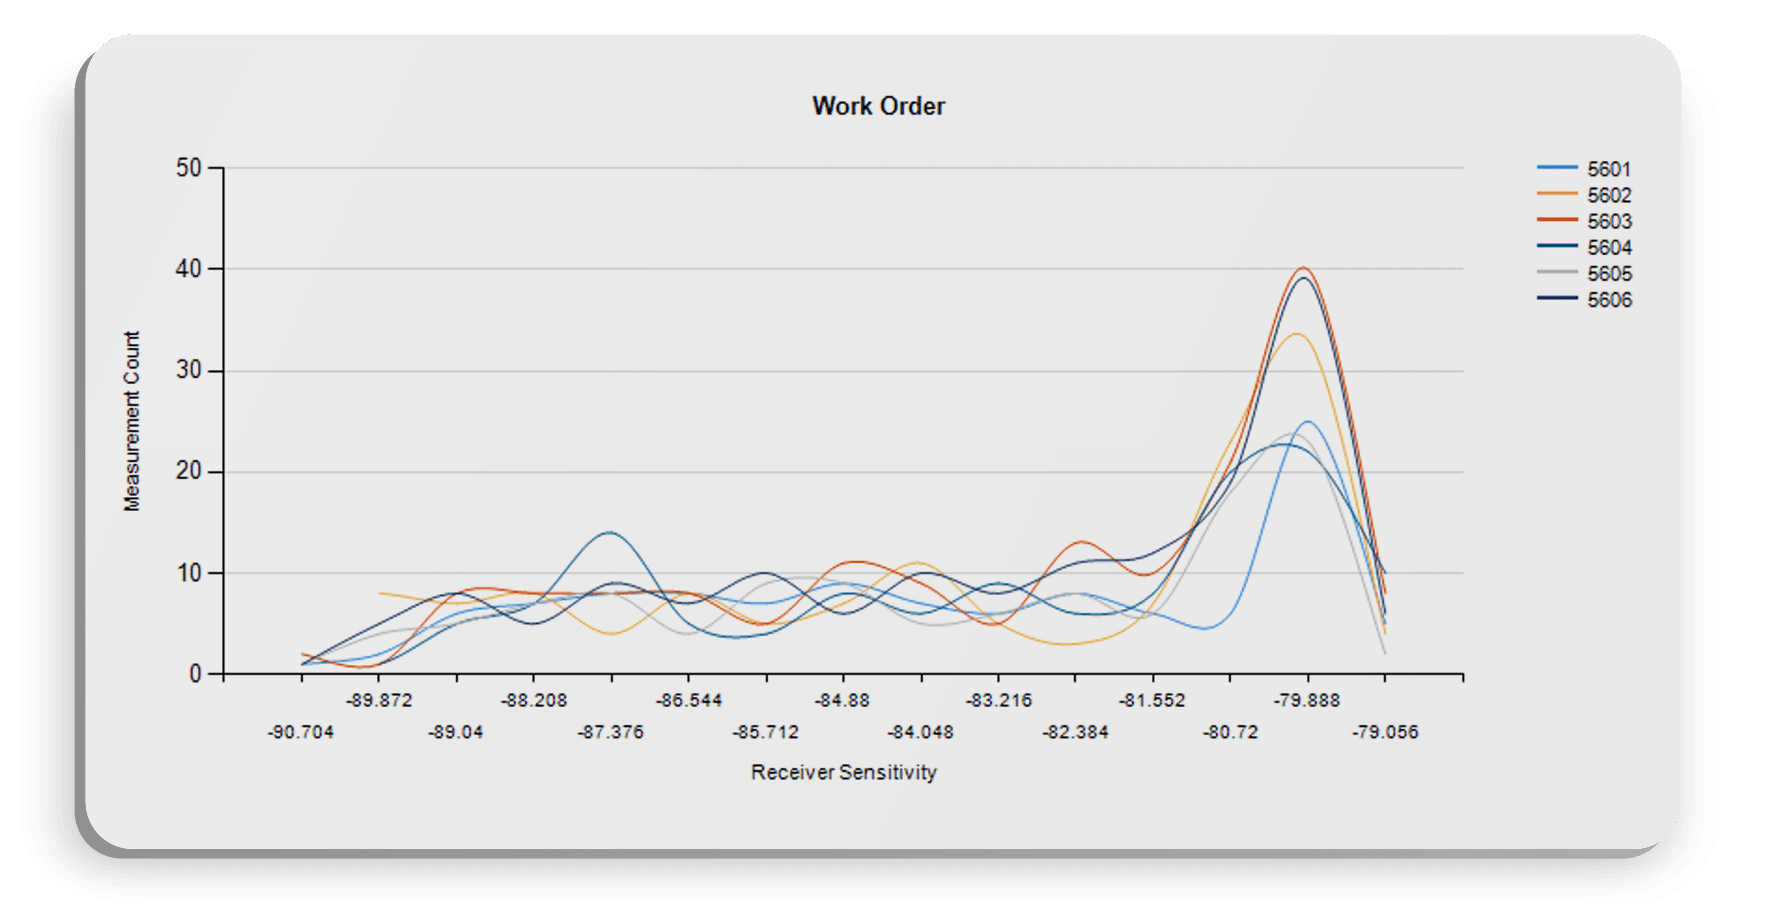
We have a few work orders all performing very similarly, so work order is probably not the influencing characteristic we’re looking for.
Let’s look at station name instead:
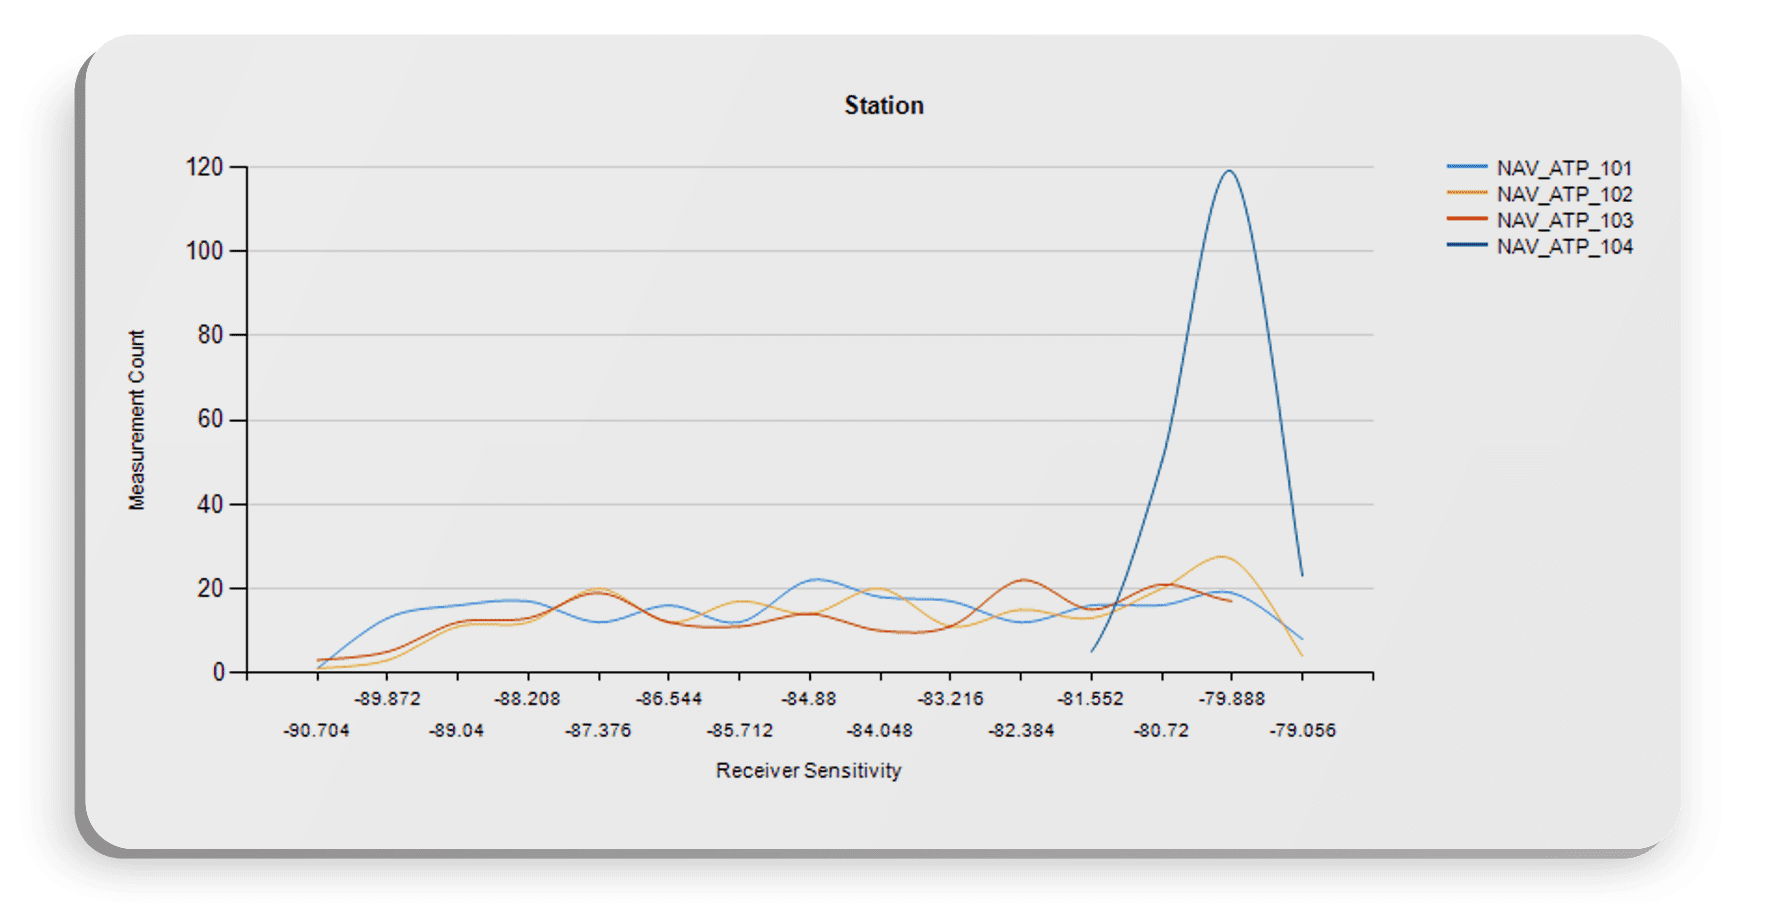
Now we have something interesting to look at. Station 104′ distribution shows that measurements on that station are performing right at the upper limit. Let’s look at a different visualization on the same data to see how the measurement is performing. Without having to re-enter parameters.
Let’s run a Measurement Characterize By report, and select Station:
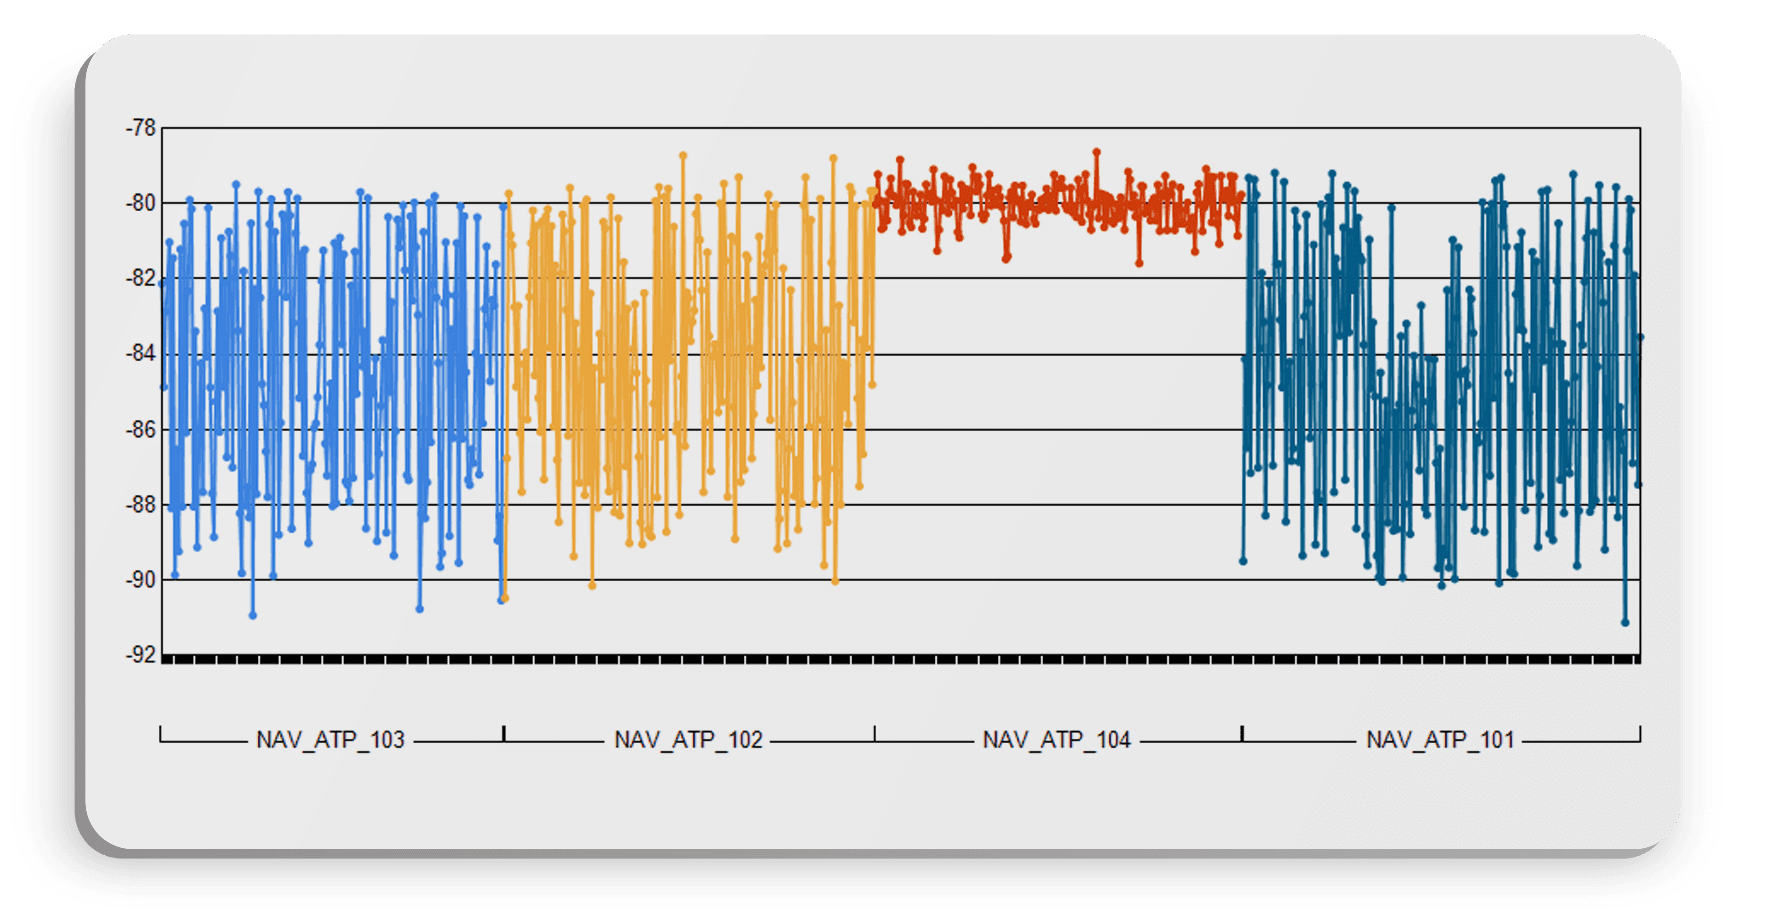
With the upper limit at -80, this station is likely a factor. Let’s dig deeper, though and validate this conclusion. This tester might have a unique configuration that is driving the performance.
Let’s change the Characterize By to Tester Configuration version:
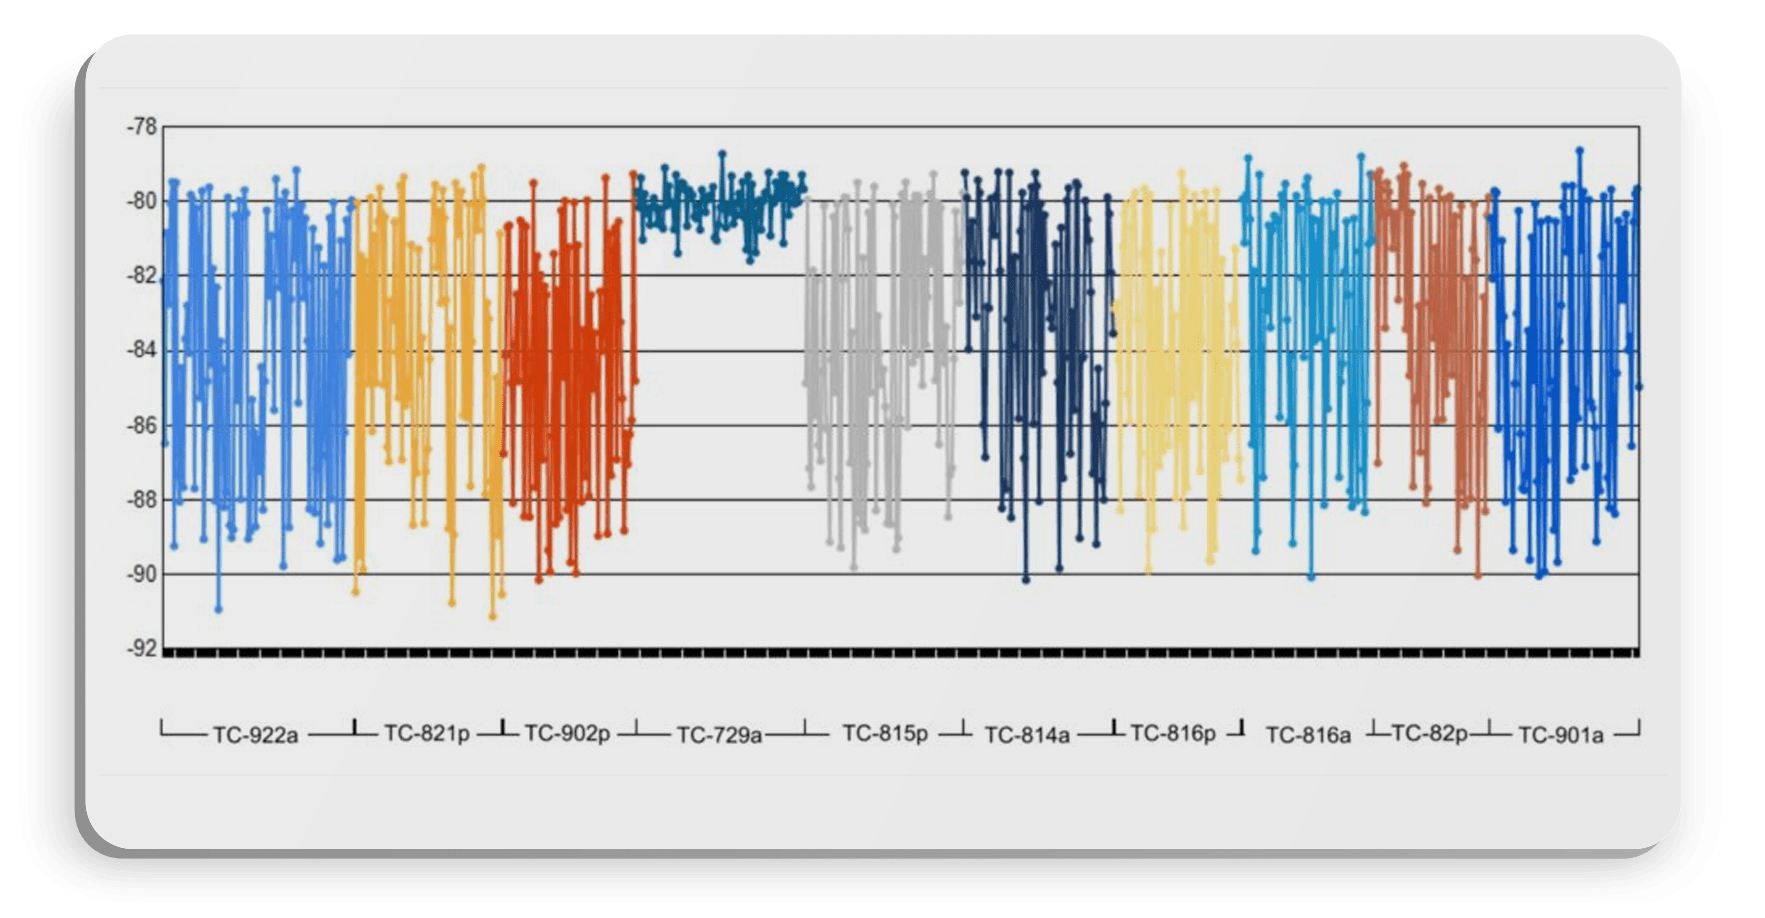
Another critical requirement is having source data that is extensible: that is, your source data can accept new attributes as needed as your process evolves. We were able to characterize by all those different meta attributes above because they were captured in the source data. What if your root-cause analysis runs into an issue because your testers are not capturing that kind of rich meta data? How do you ensure that, when you learn what is causing issues, that you start capturing the meta data that has influenced performance?
For instance, in the example above, we root caused correlations to both tester and tester configuration; both those data characteristics were stored in the source data. What if, during a root-cause analysis, your engineers identify that a factor is not something currently being gathered in your source tester data? You’ll need to start gathering that meta data/characteristics without re-validating your output or disrupting your manufacturing process.
It’s critical to consider having an extensible data model. Standards like IEEE ATML, or TestStand XML, or IntraStage XML or CSV will allow you to flexibly capture more meta data at the event, test, or measurement level without having to re-code or re-validate your test output. This will allow your engineers to capture the attributes that influence performance problems, and continuously track, trend, and improve. In addition, you’ll need the kinds of adapters and connectors that will seamlessly read, extract, and load the parametric performance and meta data characteristics that drive root-cause workflows.
The capability to use built-in workflows to root-cause SPC issues using meta data is critical to quickly root-causing those issues and applying resolutions that will increase yield and improve quality. These workflows and the ability to bring in data sources to a single source of truth speak to the importance of having a test data management and analysis solution that gives your engineers the tools and workflows to reach beyond traditional SPC.
Histogram with workflow (drill-down to histogram, and drill-down from histogram to details).
Histogram with Value Against Limits for contextual analysis.
XBar-R and -S reports for deep-dive measurement-level analysis.
Lack of visibility into failure reasons and yield issues. Lack of tracking process anomalies which impact the overall manufacturing throughput.
Lack of characterization on performance issues.
No way to be proactive on line-stopping issues and problems. Ability to monitor critical KPI’s in real-time with Alerting and enterprise level visibility.
Multiple product lines with data from across the product lifecycle, including supplier subcomponents, contract-manufactured lower-level assemblies (LLAs), and higher-level assemblies (HLAs).
Need for correlation and tracking of performance, rework and reassembly of LLAs into and with HLAs with full product genealogy.
Need to integrate Manufacturing data with enterprise systems (Flexflow-MES, Team Center – PLM, Agile PLM, Spider- QMS, BOM and Oracle – ERP/AVL ).

BlackBelt Analyze allows small manufacturing businesses to quickly process and combine data from multiple sources into a common silo for test data management analytics.
IntraStage designs and develops software for SMBs, mid level and enterprise level complex electronics manufacturers. We serve the following industries, aerospace, medical device manufacturers and consumer electronics.